

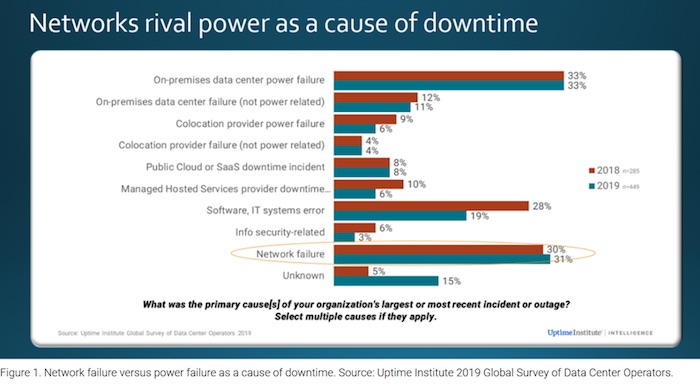
According to a recent global survey of about 1,600 IT professionals by the Uptime Institute, network failure is rivalling power failure as a cause of downtime.1
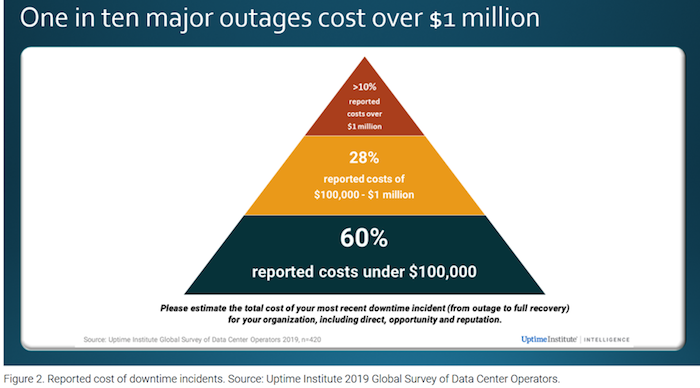
Tthe cost of outages is astronomical: According to the Cisco 2020 Global Networking Trends Report, the average cost per network outage is US$402,542 in the United States and US$212,254 in the United Kingdom.2 Further, the Uptime Institute survey found that one in ten major outages cost over $1 million.1
Correlation between visibility and network outages
Outages are increasingly spanning multiple data centres as users adopt hybrid infrastructure. Outages can result from breaches or attacks, or network or application performance-related issues. Also, outages can be simply the result of network misconfiguration.
NetOps and SecOps agree that organisations can’t manage, operate and troubleshoot what they can’t see, especially in a mixed physical, virtual and cloud-based environment.
So visibility must be context-aware L3–7, delivering a multi-dimensional overview of applications: visualisation, identification and filtering of applications running on the network, with rich attributes/metadata extraction and analysis that examines the behaviour of network, app and user.
How does pervasive visibility reduce network outages? The lack of visibility, transparency and accountability are key roadblocks to providing enhanced business productivity and quality of user experience.
In order to reduce outages, pervasive visibility must provide deep and granular insight into the application or data in motion gaining critical flow details.
Then how do we Identify and analyse data in motion? This goes beyond relying on TCP port information. The visibility platform must offer deep packet inspection into Layer 7 that automatically identifies thousands of common business, IT and consumer applications as well as thousands of HTTP web applications. Identification of traffic must include encrypted traffic, where decryption and encryption may be required without disruption or performance impact to the network.
Furthermore, the visibility platform must provide rich attributes and metadata that shed light on security and network status and to help to prevent breaches and poor performance where NetFlow falls short. These rich sets of metadata include:
- DNS parameters: Request/response, queries and device identifiers
- HTTP: URL identification, command response codes
- Identification: Social media user, file and video names, SQL requests
- IMAP and SMTP: Email-based communications with sender and receiver addresses
- Service identification: Audio, video, chat and file transfers for VoIP and messaging
- SIP and RTP: Session control and media transport for VoIP and messaging
By providing granular insight into the applications running throughout the network, the visibility platform uncovers blind spots and reduces the time and effort to capture and deliver relevant data for network, security, compliance, IT audit and application teams.
The key factors
Speed and deep packet visibility in extracting rich and meaningful metadata are key factors in reducing network outages. This includes decrypting and encrypting SSL/TLS flows where needed.
Without these capabilities, the performance and security tools won’t be able to process the sheer volume of data crossing the network and identify the root cause(s) quickly and efficiently. For example, a network can be down due to DNS, but without extracting and providing the right DNS parameters to PCAP tools, it will take IT hours or days to determine and restore network availability.
At least one advanced vendor is now supporting a visibility platform, that offers Layer 7 visibility and automatically identifies application traffic from a growing list of more than 3,000 applications. With individual application traffic identification, security and network teams can also zero in on performance issues more quickly and make the distinction between high value apps and ones needing fewer tools for coverage.
Application filtering intelligence doesn’t rely on Layer 4 (for example, TCP) port information, which can be easily spoofed. Instead, it’s powered by deep packet inspection. The classification is based on flow pattern matching, bi-directional flow correlation, heuristics and statistical analysis. Packet data is matched against analysis from researchers, which is constantly kept up to date. Of course, a significant portion of traffic on a modern network originates within users’ web browsers, so application filtering intelligence also offers deep insights into HTTP traffic, identifying traffic from thousands of web applications.
ESG economic validation
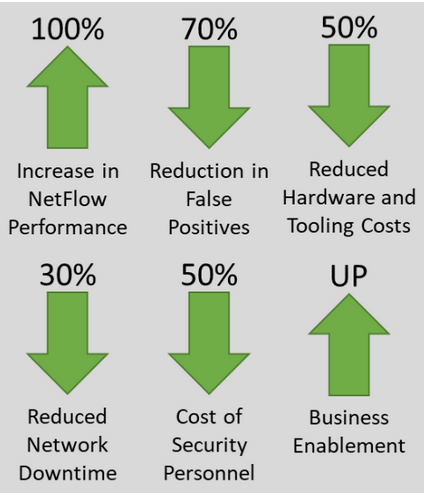
As seen in Figure 3, ESG’s Economic Validation found that customers deploying application filtering intelligence recognised substantial benefits including lower hardware costs, less time needed to analyse traffic for security, reduction in overall complexity, and improved business enablement.3
Network-related downtime is frequently estimated to be between 16 to 20 hours per end user per year. Companies deploying application filtering intelligence find their downtime numbers reduced by 30–50 percent due to the efficiency and intuitiveness of the platform. While downtime hours recovered are not always fully measurable to the bottom line, a company of 5,000 employees that recovers just two hours per employee per year will recognise a savings of $290K annually.
References
- 2019 Annual Data Center Industry Survey Results. 2019. Uptime Institute. https://uptimeinstitute.com/2019-data-center-industry-survey-results
- Cisco 2020 Global Networking Trends Report. 2020. Cisco. https://www.cisco.com/c/dam/m/en_us/solutions/enterprise-networks/networking-report/files/GLBL-ENG_NB-06_0_NA_RPT_PDF_MOFU-no-NetworkingTrendsReport-NB_rpten018612_5.pdf
- Economic Validation: Analyzing the Economic Benefits of Gigamon. 2019. The Enterprise Strategy Group. https://www.gigamon.com/resources/resource-library/analyst-industry-reports/ar-esg-evv-gigamon.html